Usage Details
Overview
The Usage Details tab answers the question: "What exactly is consuming capacity?". When the License Status dashboard shows a high usage rate, you can come here to inspect row by row how much each CI category occupies and by what coefficient it is converted, so you can find the "capacity hogs" and plan an optimization strategy.
The page is divided into two areas from top to bottom:
- Module usage summary — top statistic cards showing the total consumption of the CI module and the platform-wide total consumption
- CI category details — a data table listing count, weight, coefficient, and converted units row by row, by category and source type
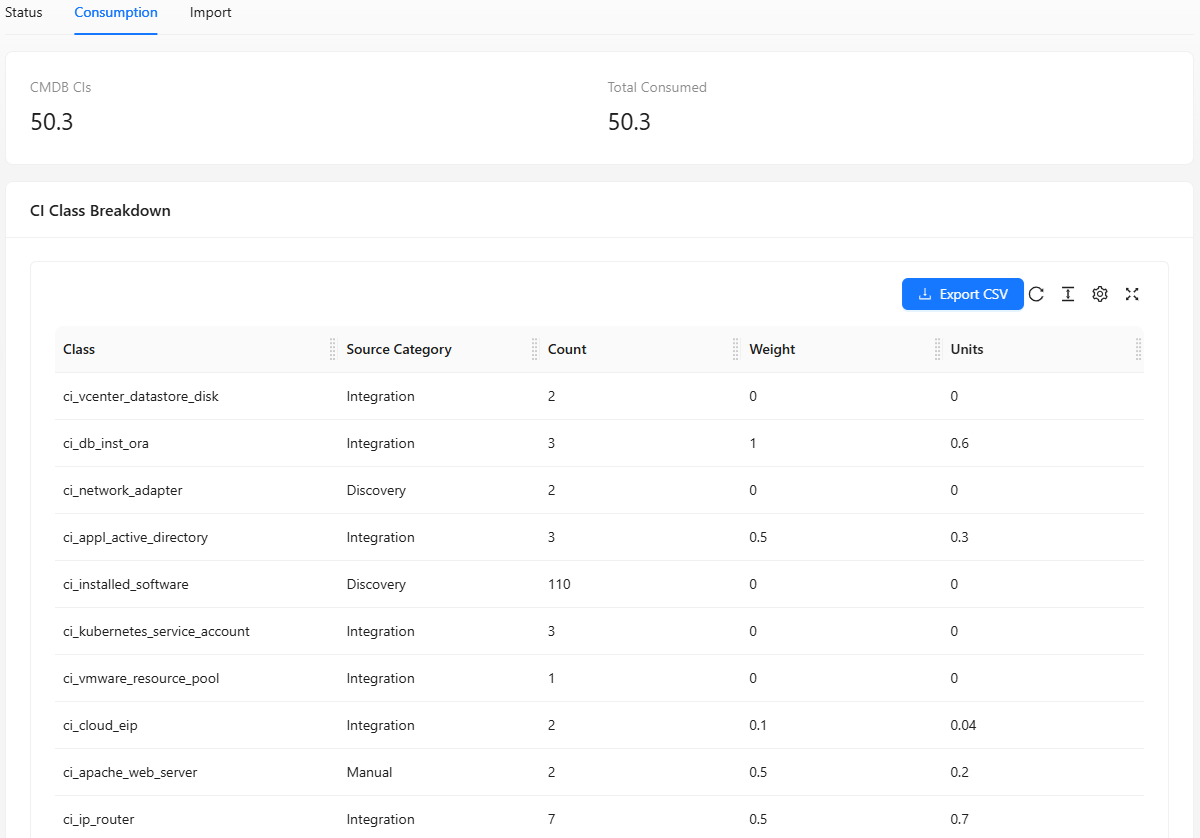
Module Usage Summary
The statistic cards at the top of the page show how capacity is distributed across different modules.
| Metric | Meaning |
|---|---|
| Configuration Items | The total units currently consumed by the Configuration Item (CMDB) module |
| Total consumption | The combined total units consumed by all modules platform-wide |
Capacity billing in the current release primarily covers the Configuration Item (CMDB) module. Billing for modules such as Monitoring and Automation will be added in future releases, at which point this area will show usage for additional modules.
CI Category Details
Below the summary cards is the CI category details table — the core tool for tracking down the source of capacity consumption. The table shows the conversion details for each "category + source type" combination row by row.
For common table operations such as column management, pagination, and density, see Common Data Table Operations.
Column Descriptions
| Column | Meaning | How to use it |
|---|---|---|
| Category | The CI classification name (e.g. Server, NetworkDevice, Application) | Identify which type of device is consuming capacity |
| Source type | The CI source classification (auto-discovered / manual / integration, etc.) | Understand how capacity is being consumed by which entry method |
| Count | The raw count of CIs in this category | See absolute numbers |
| Weight | The billing weight for this category — different categories have different "unit prices" | Understand the billing multiplier for this category |
| Units | Count × weight × coefficient = the actual consumed units | The most important column — this is the actual capacity occupied by this row |
Source Type Description
The "Source type" column shows the CI's original source classification (source_category), rather than a simple "auto / manual" binary. Common values include:
| Source type | Meaning |
|---|---|
| Auto-discovered | Devices automatically scanned and managed by the discovery collection module |
| Manual | CIs created manually through the UI or via API |
| Integration | CIs entered through the integration feature |
Different source types correspond to different billing coefficients, so within the same category, auto-discovered and manually entered items are displayed as two separate rows.
If the "Computer" category has both auto-discovered devices and manually entered devices, the table will show two rows — one for Computer / Auto-discovered and another for Computer / Manual — because even though the base weight for the Computer type is the same, the billing coefficients for these two sources differ.
Billing Conversion Example
Suppose the table contains these rows:
| Category | Source type | Count | Weight | Units |
|---|---|---|---|---|
| Computer | Auto-discovered | 100 | 1.0 | 100 |
| Computer | Manual | 20 | 1.0 | 4 |
| Network Device | Auto-discovered | 50 | 0.5 | 25 |
- Computer (auto-discovered): 100 × 1.0 × 1.0 = 100 units
- Computer (manual): 20 × 1.0 × 0.2 = 4 units (manual entry has a lower coefficient)
- Network Device (auto-discovered): 50 × 0.5 × 1.0 = 25 units (network devices have a lower weight)
The Units column lets you see at a glance which "category + source type" combination is the "capacity hog". In the example above, auto-discovered Computers are the largest consumption source.