Quick Start
This guide walks you through five real-world operations scenarios to quickly get hands-on with Huayang CMDB — focusing on the platform's two core capabilities: Auto-Discovery (devices are automatically brought under management as soon as they come online) and AI Assistant Collie (query, analysis, and changes completed in a single sentence). Finally, you'll turn the results into a persistent data dashboard for continuous visibility.
System Preparation
Before starting with CMDB, please ensure the following preparations are complete:
- Installation and Deployment: The system has been installed and deployed. For installation, please refer to the Installation Steps. The system will automatically install the built-in data models (CI types, relationship types, etc.).
- Data Import: You can use the Load Demo Data feature in the global toolbar to quickly import demo data.
- Modern browser (latest version of Chrome, Firefox, Edge)
- Network connection
- Valid user account
Login to System
- Open a browser and visit the system address
- Enter your username and password
- Click the "Login" button
After logging in, you will see the main interface of AI Assistant Collie — a conversation-centric intelligent workbench:
- Sidebar (left): System navigation menu. Click to switch between functional modules (CIs, Discovery & Collection, Dashboards, etc.)
- Conversation List: Collie's conversation history. You can create new, switch between, and review past Q&A sessions
- Conversation Area: The core area. A new session displays a set of recommended prompts (e.g., "CI Overview", "Impact Analysis", "Create Dashboard") — click to ask directly, or type your question in natural language in the input box at the bottom
- Structured Responses: Collie's replies are more than just text — they include execution steps (showing the reasoning and tool call process), clickable resource reference links (jumping directly to related CIs, queries, CI types, and other resources), and when data changes are involved, an approval card pops up — Collie only executes after your confirmation
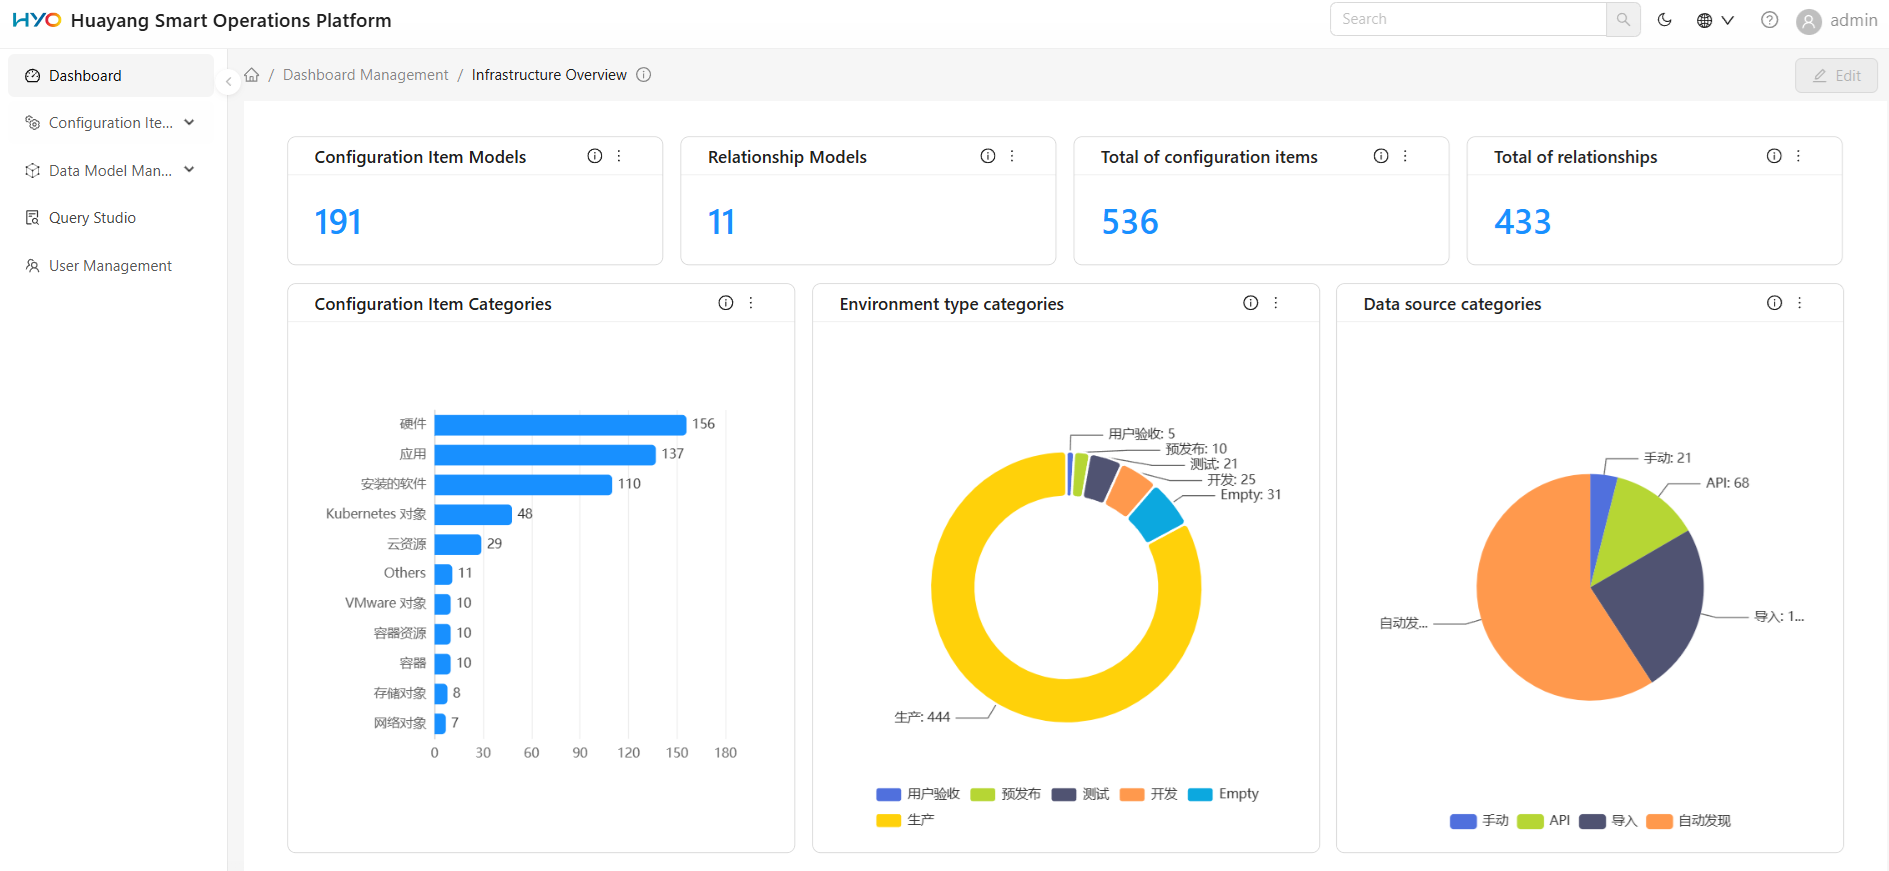
Next, we'll walk through five scenarios that connect the complete closed loop of "automatic collection → AI analysis and decision-making → continuous visualization".
Scenario 1: Auto-Discovery — Experience the Built-in Discovery Pipeline
The platform ships with a complete auto-discovery pipeline out of the box — the Local network discovery zone plus 4 discovery rules — ready to run. You only need to do two things to get it going: fill in your own network's IP range in the collection zone and provide device login credentials in the collection rules. It will then scan your local network as configured and automatically bring active devices under management as CIs.
The entire pipeline works as follows: Collection Zone (where to look, which protocol to probe) → Collection Rules (what to automatically do with detected devices by type) → devices automatically become Collection Points and CIs. All scanning and collection is performed through Collection Agents — the platform includes a default agent at installation (Default Proxy), and Local network uses it by default.
Step 1: Configure the Discovery Zone — Enter Your Network IP Range
- In the left navigation, select Discovery & Collection > Collection Zones
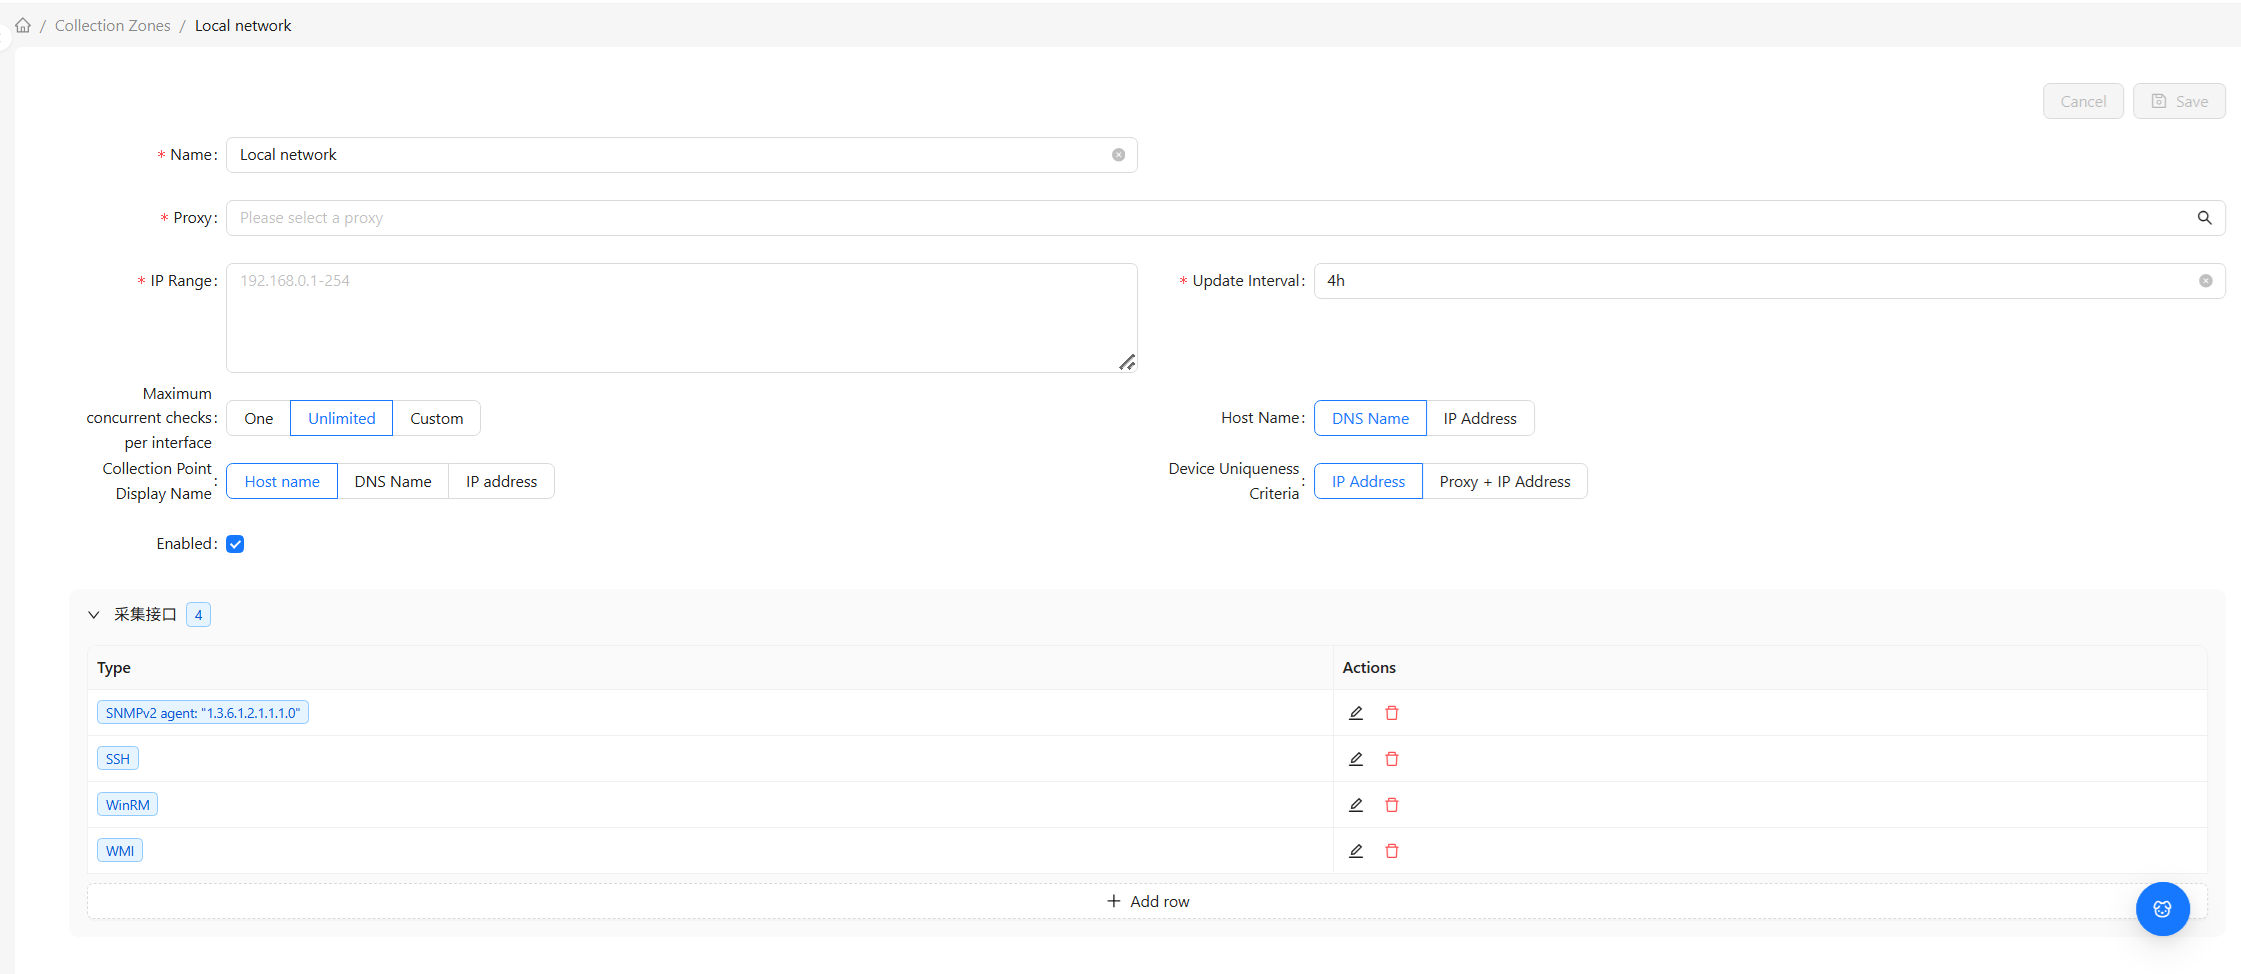
- Find the built-in Local network, click edit, and enter your own network's IP address range (the default is left empty — you must specify the actual network segment to scan), for example
192.168.1.1-254 - Keep the other settings at their defaults:
- Check interval: Scans every 4 hours
- Collection protocols: All 4 probe types enabled —
SSH(port 22),WinRM(port 5985),WMI(port 135),SNMP(port 161) - Collection agent: Default Proxy (platform built-in)
- After saving and enabling, it scans your specified network segment every 4 hours, probing for active devices using these 4 protocols
Step 2: Configure Discovery Rules — Provide Device Login Credentials
The 4 built-in rules define "devices detected with a certain protocol are brought under management as the corresponding type," but to actually collect data from these devices, you need to provide the login credentials for the target machines.
-
In the left navigation, select Discovery & Collection > Collection Rules
-
Here you'll find 4 discovery rules, each corresponding to a probe protocol. When matched, devices are automatically brought under management as the corresponding type:
Discovery Rule Trigger Condition (Probe Protocol) Automatically Onboarded As Credentials Needed Auto discovery for Linux and macOS SSH Linux / macOS servers SSH login account / password Auto discovery for Windows by PowerShell WinRM Windows servers Windows account / password Auto discovery for Windows by WMI WMI Windows servers Windows account / password Auto discovery for network devices by SNMP SNMP Network devices SNMP community -
In the Link Template action for each rule — in the subsequent configuration after selecting the corresponding template — enter the unified login username and password for this type of device (devices of the same type within the same collection zone typically share a set of credentials). Once credentials are in place, the rule can log into devices and begin collecting data when matched
-
The actions after each rule match are the same: Add Collection Point + Link Corresponding Template + Join Corresponding Collection Group — the device is then automatically onboarded
Step 3: View Auto-Onboarding Results
At the next scan cycle (or by temporarily connecting a test device that supports one of the protocols), discovered devices will match the corresponding rule based on the detected protocol:
- Go to Discovery & Collection > Collection Points — new devices have automatically appeared as collection points, with the template and collection group assigned by the rule
- Go to Configuration Items > CI Directory — under the corresponding types (e.g., Linux servers, Windows servers, network devices), you can see these devices have automatically become CI instances
Local network + 4 rules is the example pipeline shipped with the platform — ready to experience right after installation. To onboard other network segments or custom types, create your own rules in Collection Zones and Collection Rules — for detailed configuration, see Discovery & Collection.
Scenario 2: Collie — Locate a CI in One Sentence
You receive a ticket to handle a server named uos-web-01, but you don't remember which type it belongs to, what environment it runs in, or what its upstream and downstream dependencies are. Instead of digging through the type tree, just ask Collie.
Use Collie for Natural Language Lookup
- Click the Collie (AI Assistant) button in the lower-right corner to open the conversation panel
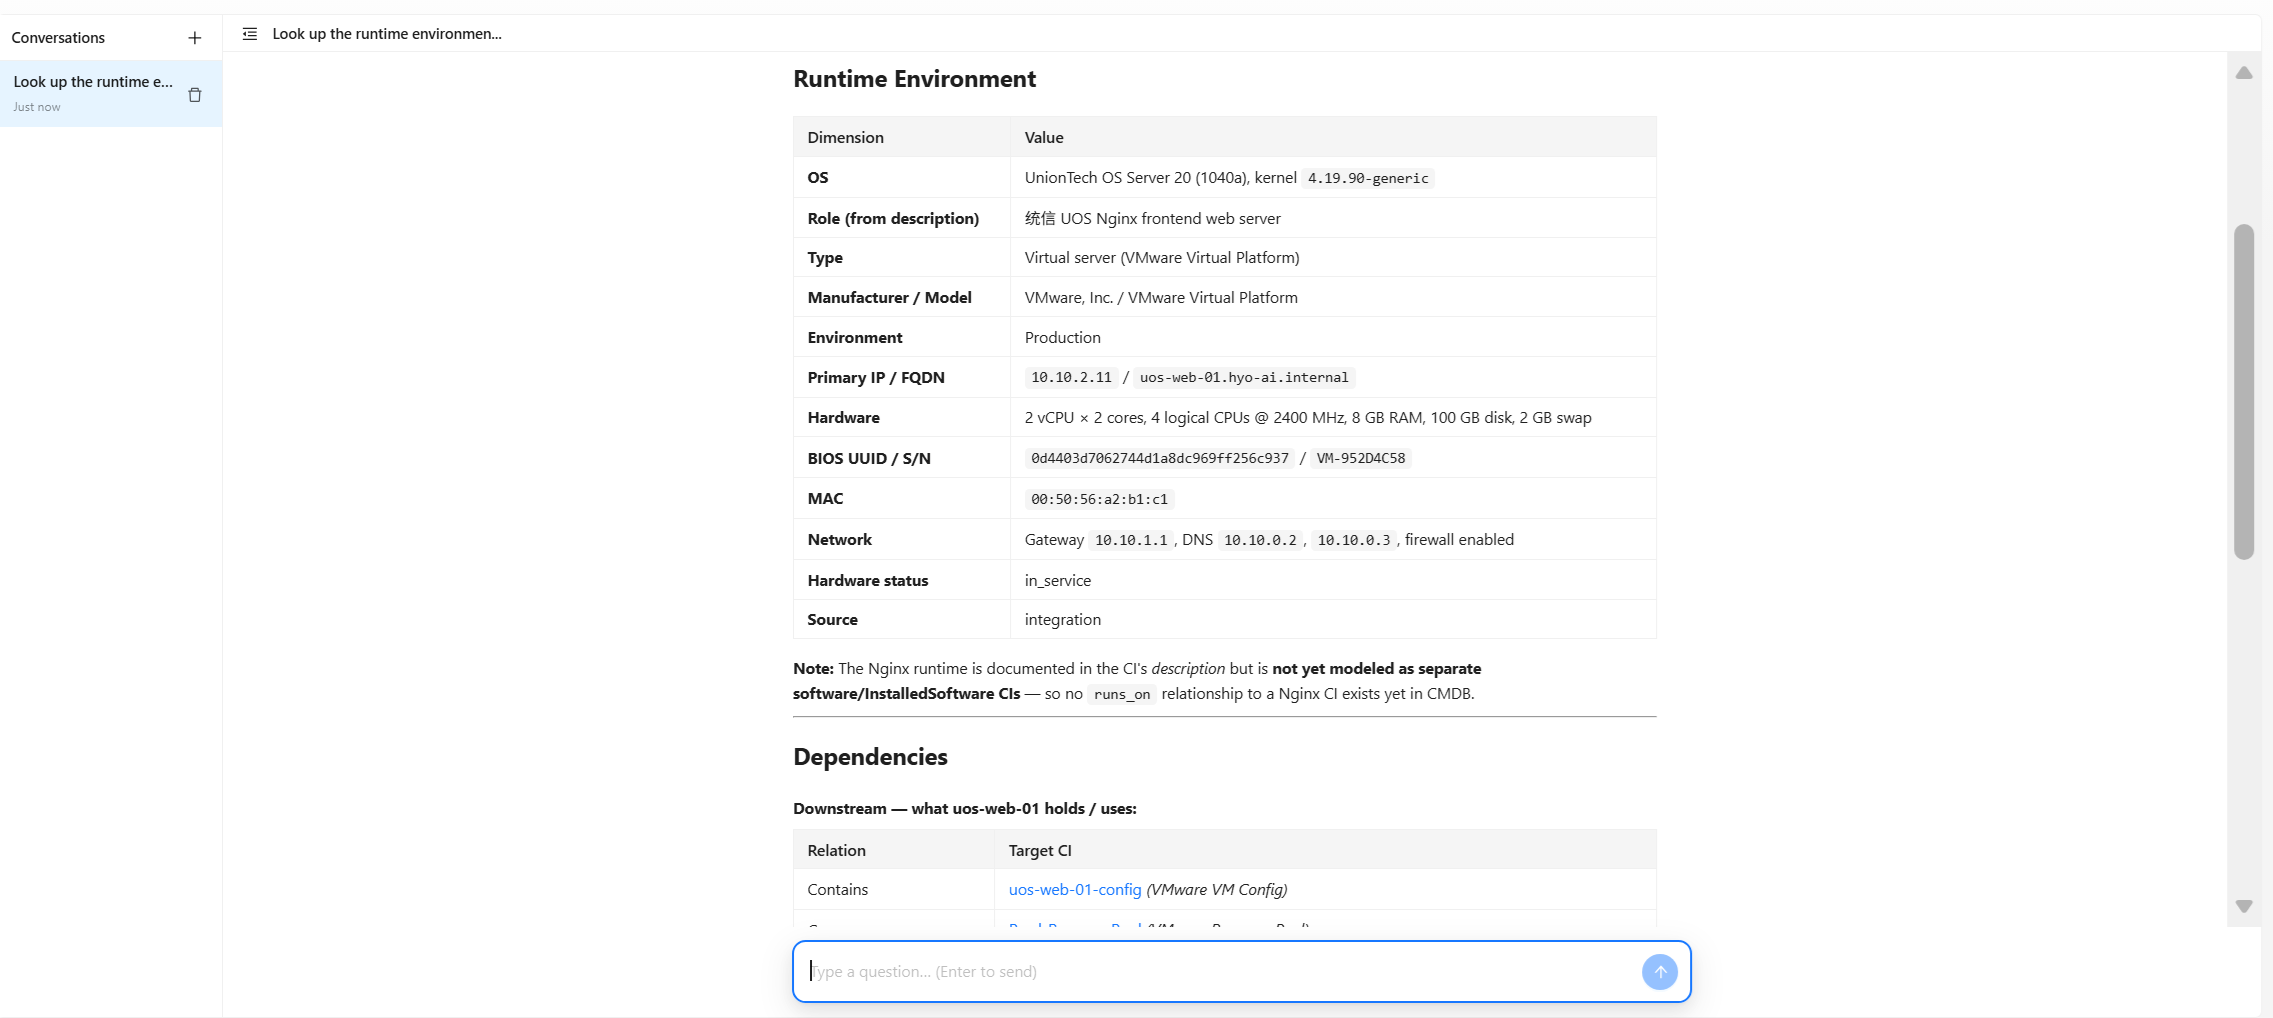
- Type: "Look up the runtime environment and dependencies of uos-web-01"
- Collie returns the CI's type, key attributes (serial number, operating system, runtime environment, etc.), and its upstream and downstream dependencies
- To dig deeper, follow up with questions like "Which load balancer is it behind?"
(Comparison) Manual Lookup Methods
Without Collie, the system also provides three ways to find CIs:
- Global Search: Enter
uos-web-01directly in the search box at the top - CI Directory: Configuration Items > CI Directory, browse by type tree
- CI List: Configuration Items > CI List, filter by preset views
Once found, enter the Detail Page and view different dimensions through tabs: Details (attributes), Component Resources (sub-components), Configuration Topology (relationship graph), Change History (modification records).
For everyday queries, ad-hoc troubleshooting, or when you can't recall the type hierarchy — a single sentence is faster than clicking through multiple menu levels. For queries that need precise filtering and saved reuse, CI List or Query Studio is still the right choice.
Scenario 3: One-Click Fault Impact Analysis
Customer service reports a fault in an OA system. You need to quickly assess the impact scope: which servers does it run on? Which databases does it depend on? If a particular server goes down, which business services will be affected?
Use Collie for One-Sentence Impact Analysis
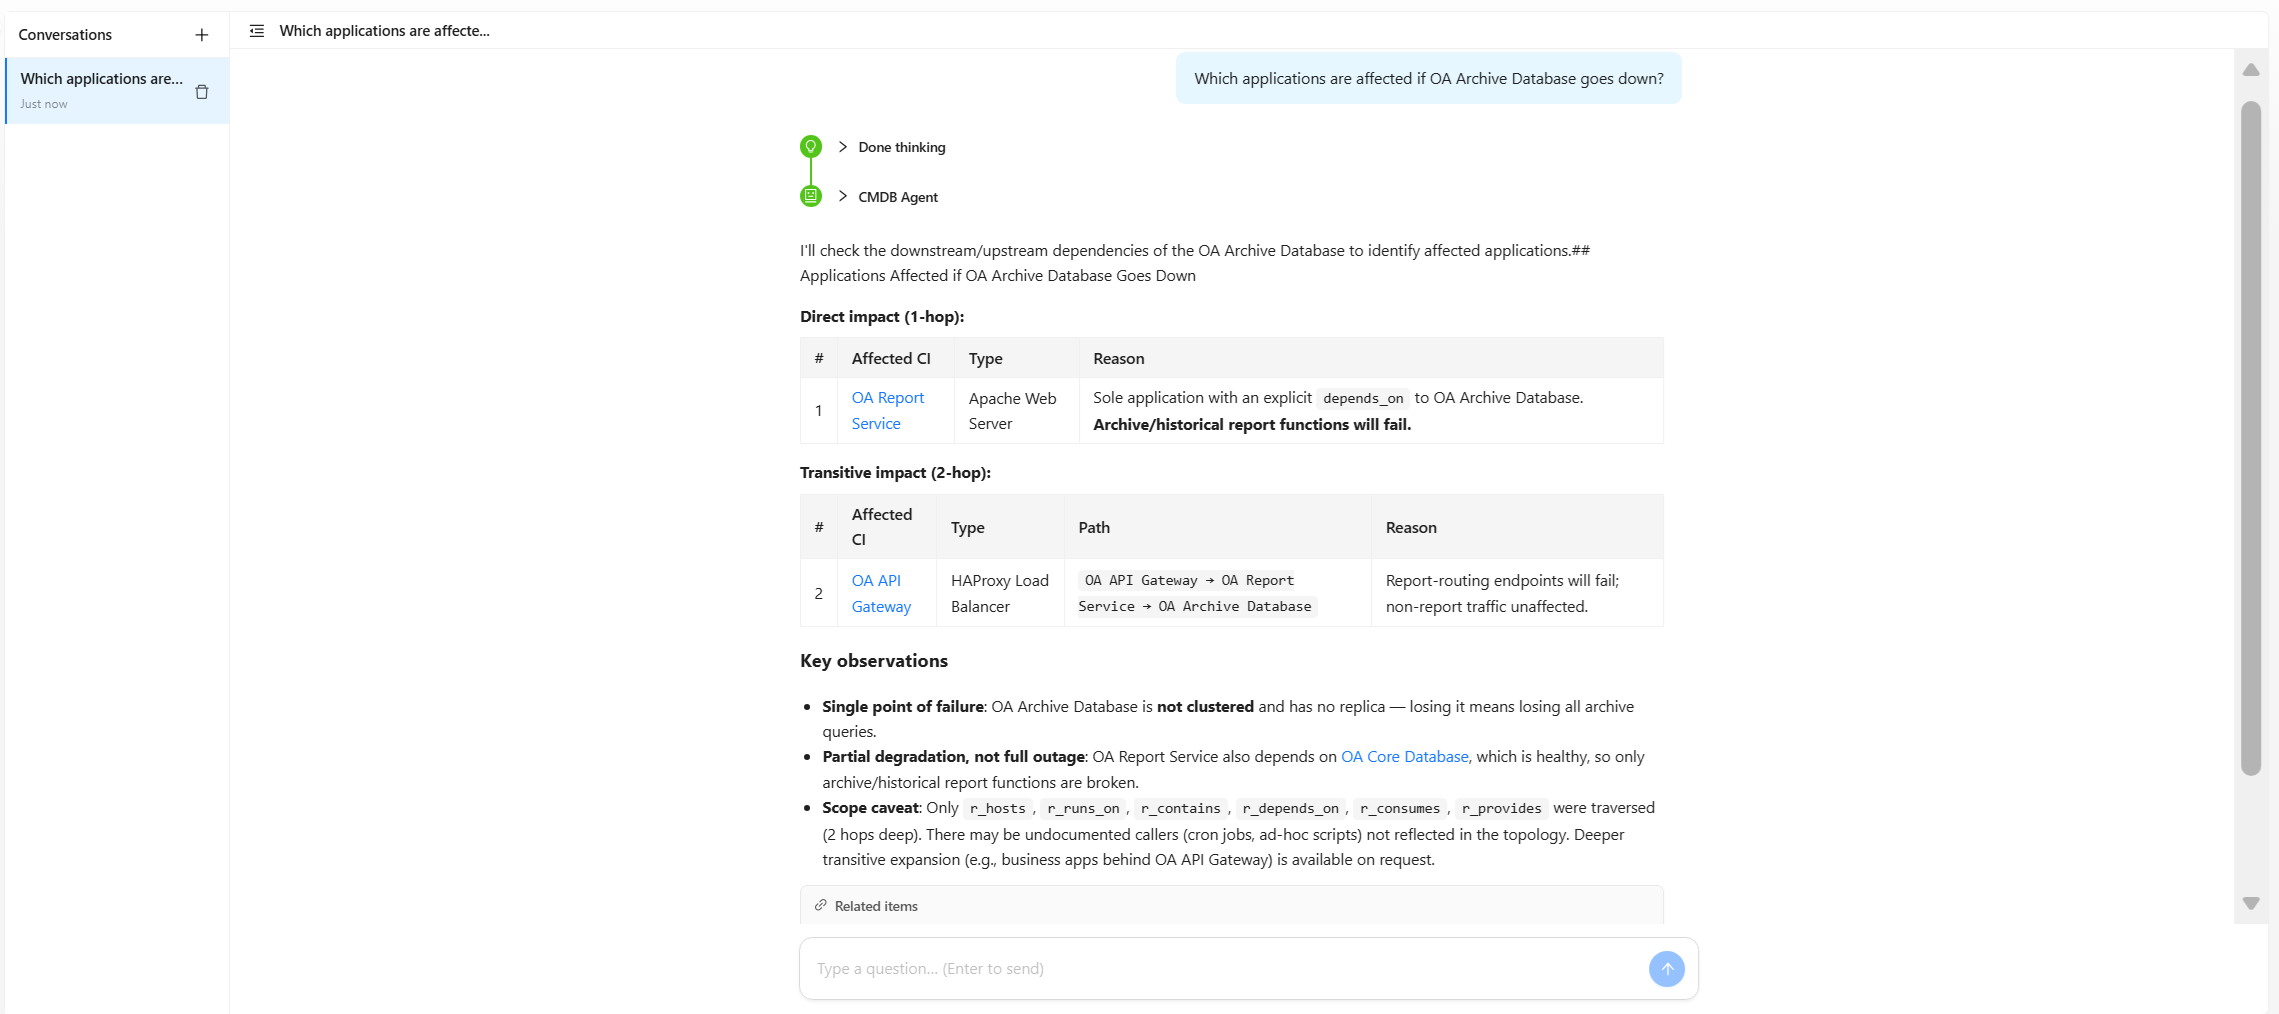
- Open Collie and type: "Which applications are affected if OA Archive Database goes down?"
- Collie traces the dependency relationships between CIs and lists the affected applications and dependency chains
- When you need a visual, follow up with: "Draw the dependency topology," and Collie produces a visualization of upstream and downstream relationships
(Comparison) Manual Construction with Query Studio
The same analysis can be done manually in Query Studio: create a query definition → drag Application, Computer, and Database Instance onto the canvas → connect them with depends on lines → preview results (list / graph view). Ideal for business impact queries that need to be reused and standardized.
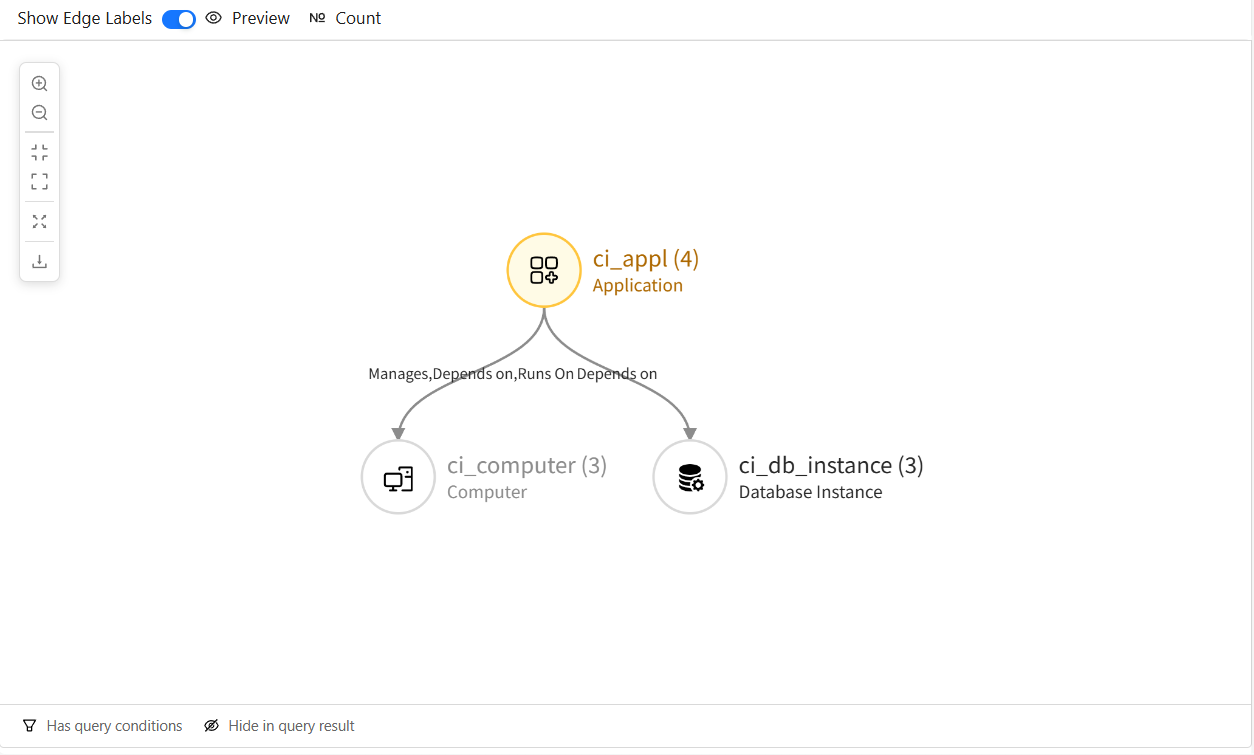
Emergency troubleshooting, one-off inquiries → Collie in one sentence is fastest; standardized queries that need to be saved, reused, and feed dashboards → Query Studio for fixed queries + CI Topology View to browse query results. The two are complementary.
Scenario 4: Collie — AI Executes Batch Changes (with Confirmation)
To meet domestic innovation (Xinchuang) asset inventory requirements, you need to tag all servers running domestic operating systems with a "Xinchuang" label. Changing them one by one is too slow — tell Collie your intent and let it handle the batch, but it will ask for your confirmation before any critical operation.
Steps
- Open Collie and state your intent: "Tag all servers running UOS (UnionTech OS) with the 'Xinchuang' label"
- Collie filters matching servers by condition (e.g.,
uos-web-01,uos-app-01), pops up a confirmation required card for your approval - After verifying everything is correct, click Approve — Collie adds the "Xinchuang" tag to these servers in batch. If you have concerns, click Reject and Collie will not modify any data
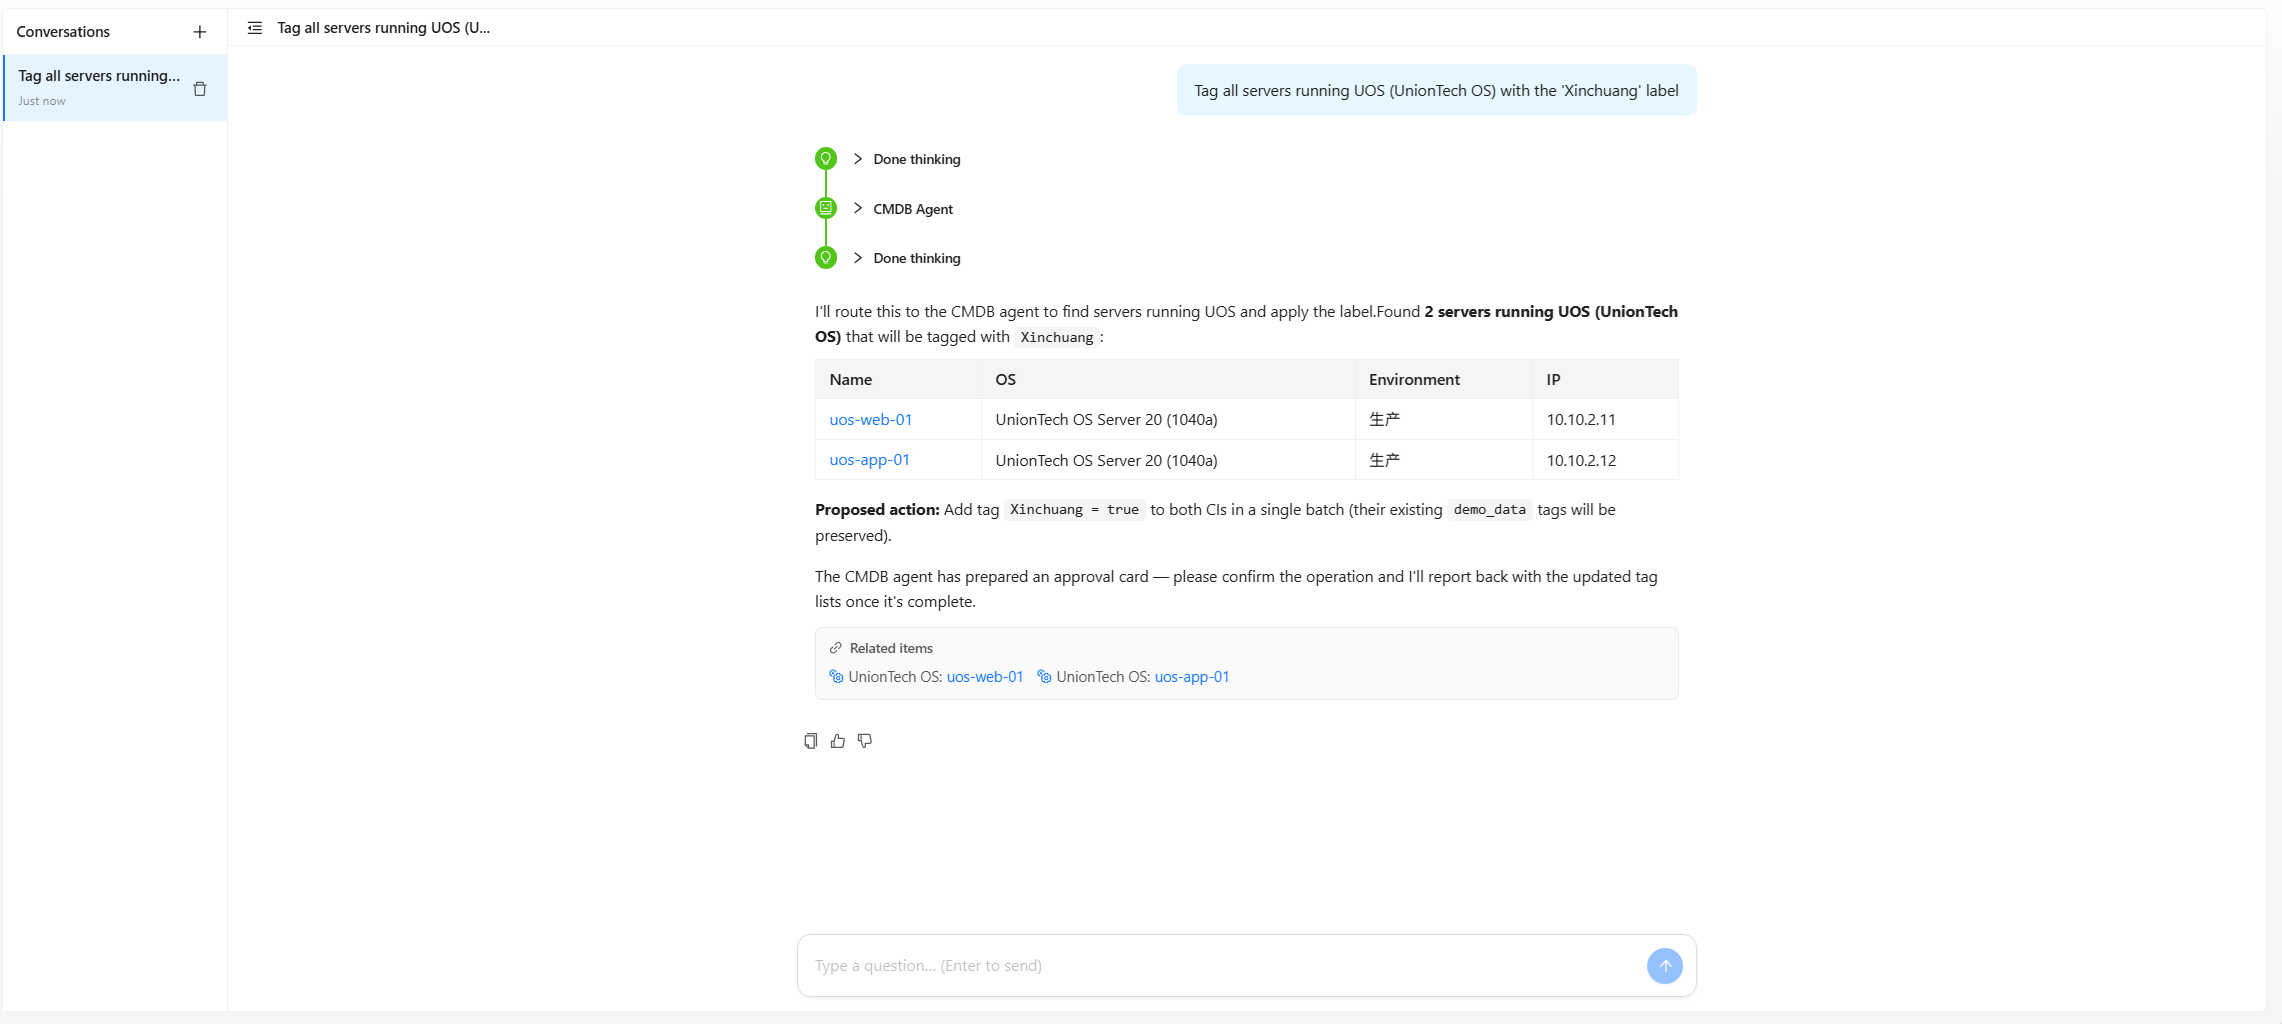
For data change operations, Collie always presents the plan first and executes only after your confirmation (nothing is modified silently). This lets you enjoy the efficiency of "batch operations in one sentence" while maintaining full control over write operations.
Scenario 5: Create a Data Dashboard — Turn Global Operations into Persistent Views
After the preceding auto-discovery, onboarding, and Collie analysis, you now have a set of continuously updated CI data and several commonly used analysis perspectives. Solidify them into an operations dashboard that "shows the full picture at a glance" instead of re-querying every time.
Steps
- In the left navigation, select Dashboards to enter the dashboard list
- Click New to create a custom dashboard (e.g., "Data Center Operations Dashboard")
- Enter edit mode and add widgets — dashboards currently support statistics by CI attributes, turning the previously onboarded and analyzed data into persistent views:
- CI distribution by type: See at a glance which types of devices are under management and how many of each
- Application business criticality statistics: Group applications by business criticality (High / Medium / Low) to instantly identify core business systems
- Machine data source distribution: Break down machines by data source (auto-discovery / integration / manual) to understand the composition of onboarding methods
- Each widget's data source can be set to CI Instances or CI Types and Relationships — adjust as needed
- After saving, switch to View Mode for at-a-glance visibility in daily use; return to Edit Mode when adjustments are needed
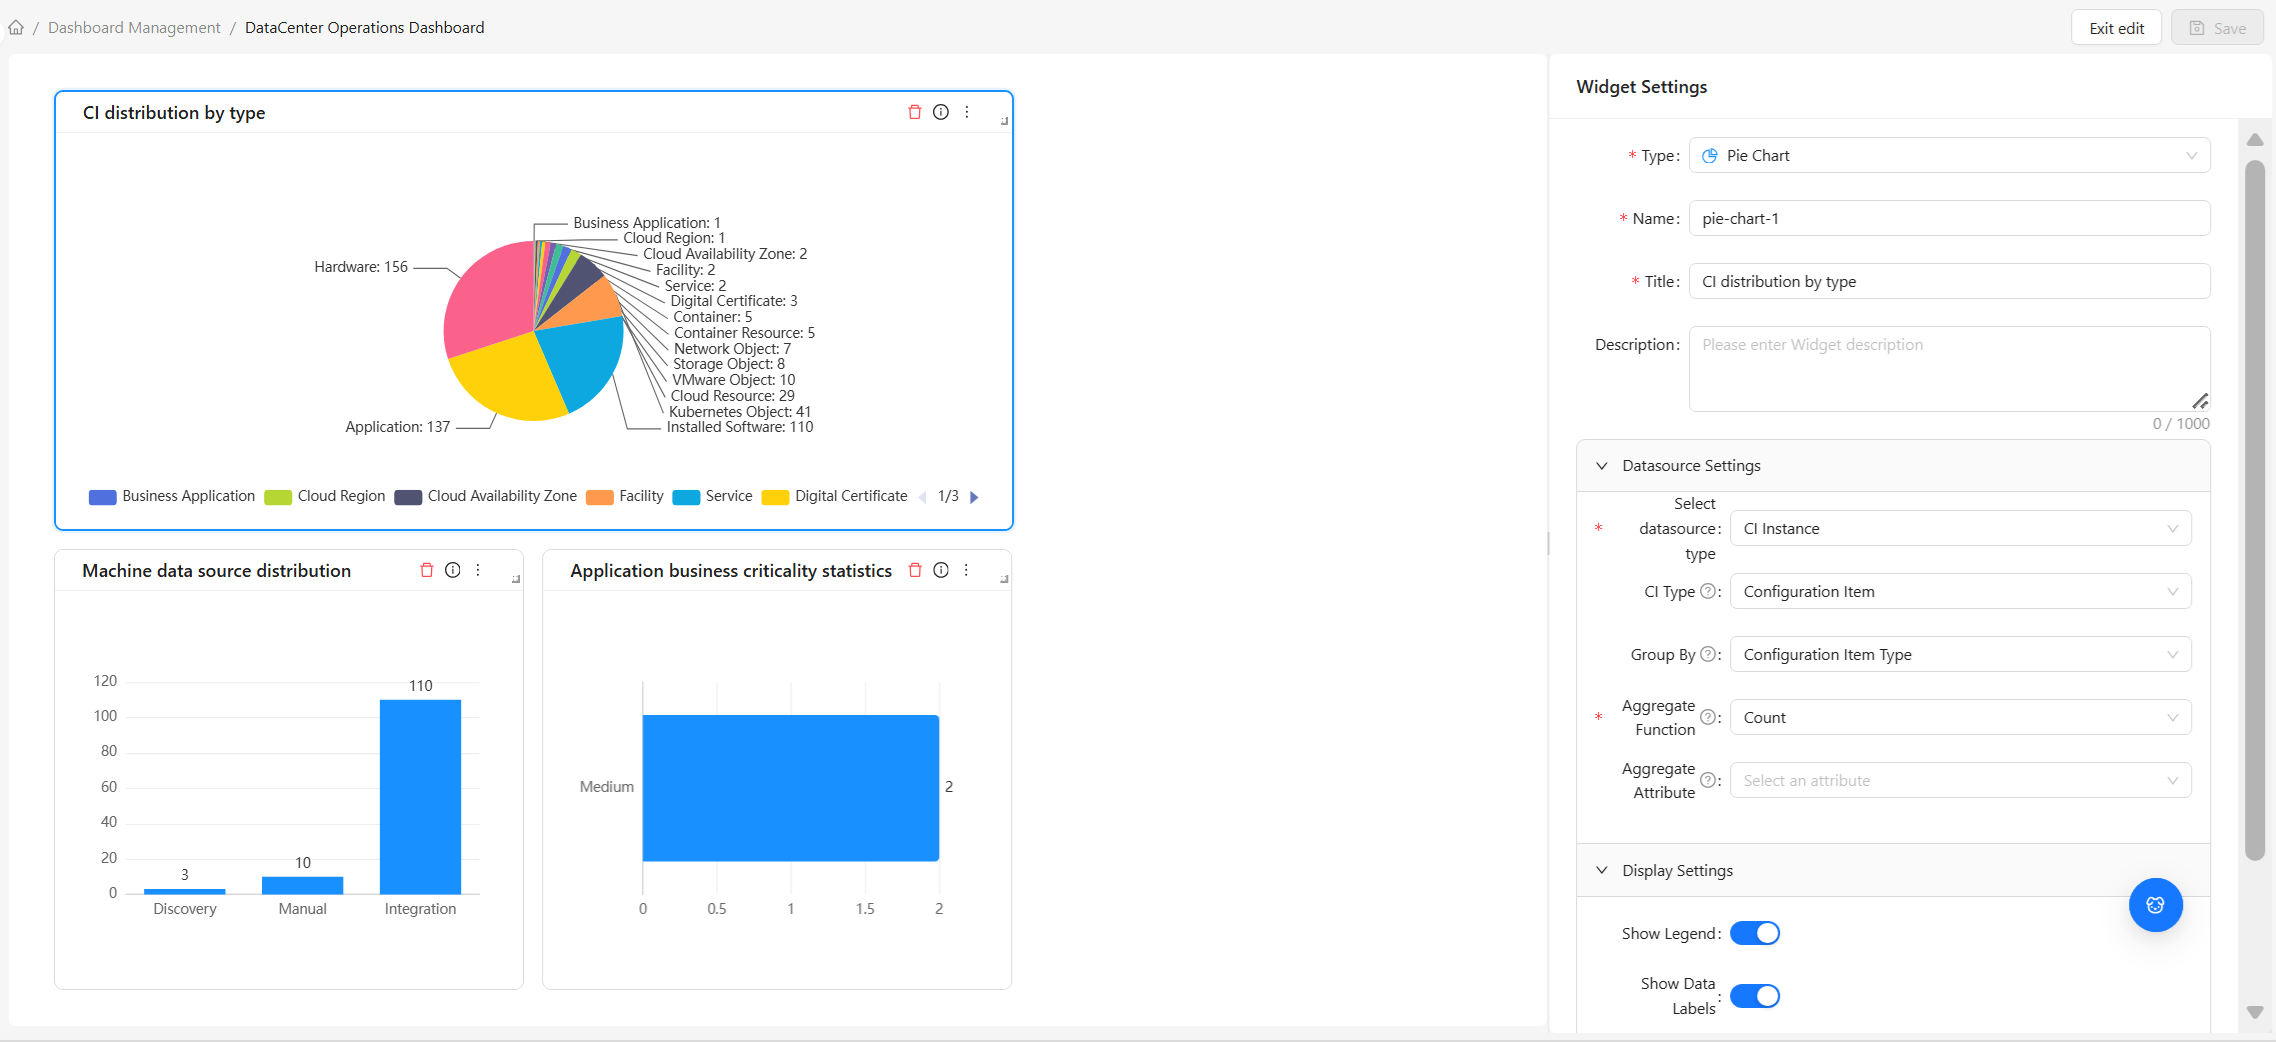
Dashboards have two modes: View and Edit. System preset dashboards cannot be modified — they are view-only; custom dashboards can be edited at any time. Dashboard data is retrieved in real time when opened — just refresh to get the latest data.
Next Steps
Now that you've experienced the complete closed loop of "automatic collection → AI analysis and decision-making → continuous visualization," you can:
- Read Core Concepts for a deeper understanding of the data model and each module's role
- View the Glossary for professional terminology
- Learn the full configuration of Discovery & Collection (collection zones / rules / points / templates / agents)
- Explore detailed documentation for each module to master advanced features
FAQ
Q: What can Collie do, and is it safe?
A: Collie can query CIs in natural language, analyze topology relationships, trace change history, and execute data changes (batch attribute edits, disabling, tagging, etc.) after your confirmation. All write operations present a plan first and require your approval — no data is ever modified silently.
Q: What if auto-discovery doesn't find any devices?
A: Common causes: (1) incorrect IP range; (2) the device doesn't have the corresponding protocol enabled (e.g., probing with SNMP only when SNMP isn't running) — try ICMP ping first; (3) the platform can't directly reach the target network — deploy a Collection Agent and specify it in the collection zone.
Q: How do I quickly find a specific CI?
A: Three ways: (1) ask Collie; (2) use Global Search; (3) browse by type in CI Directory / filter by view in CI List.
Q: Can data modifications be undone?
A: Most operations cannot be undone, but: CI modifications have change history records; deletions have confirmation dialogs; and changes executed through Collie are confirmed first. It is recommended to back up data before important operations.
Q: Does the system support multiple languages?
A: Yes, it currently supports Chinese and English. You can switch languages in the global toolbar.